Real-time Incident Management with Site24x7

Incident management works best when all of your incidents and alerts can be tracked from a centralized hub. Site24x7 offers comprehensive monitoring for critical network devices such as routers, switches and firewalls, providing assistance for network teams to do deep performance visibility required to manage complex networks.
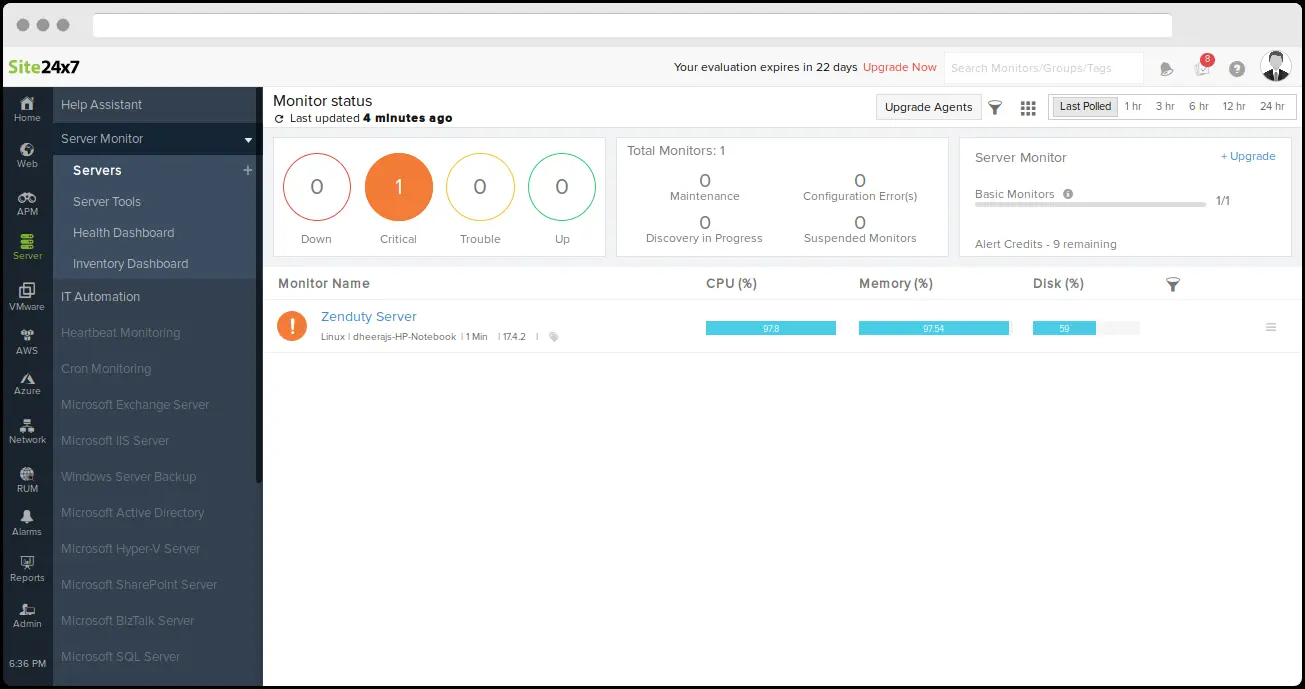
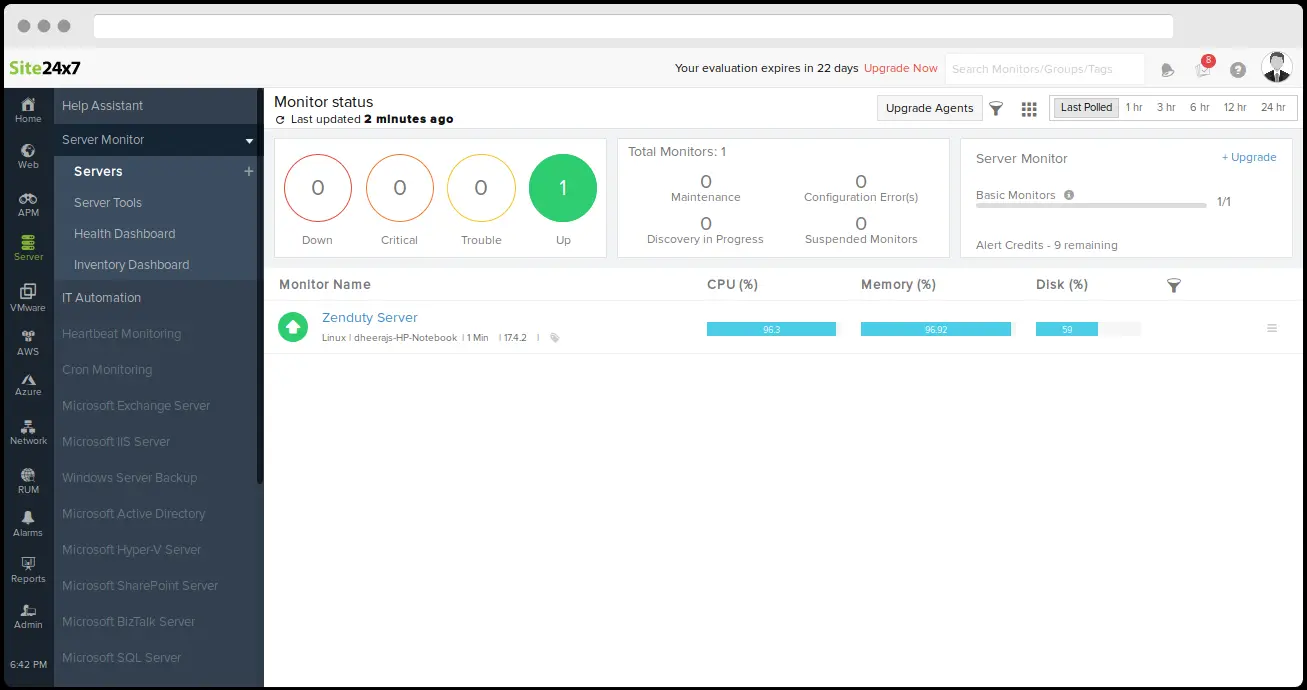
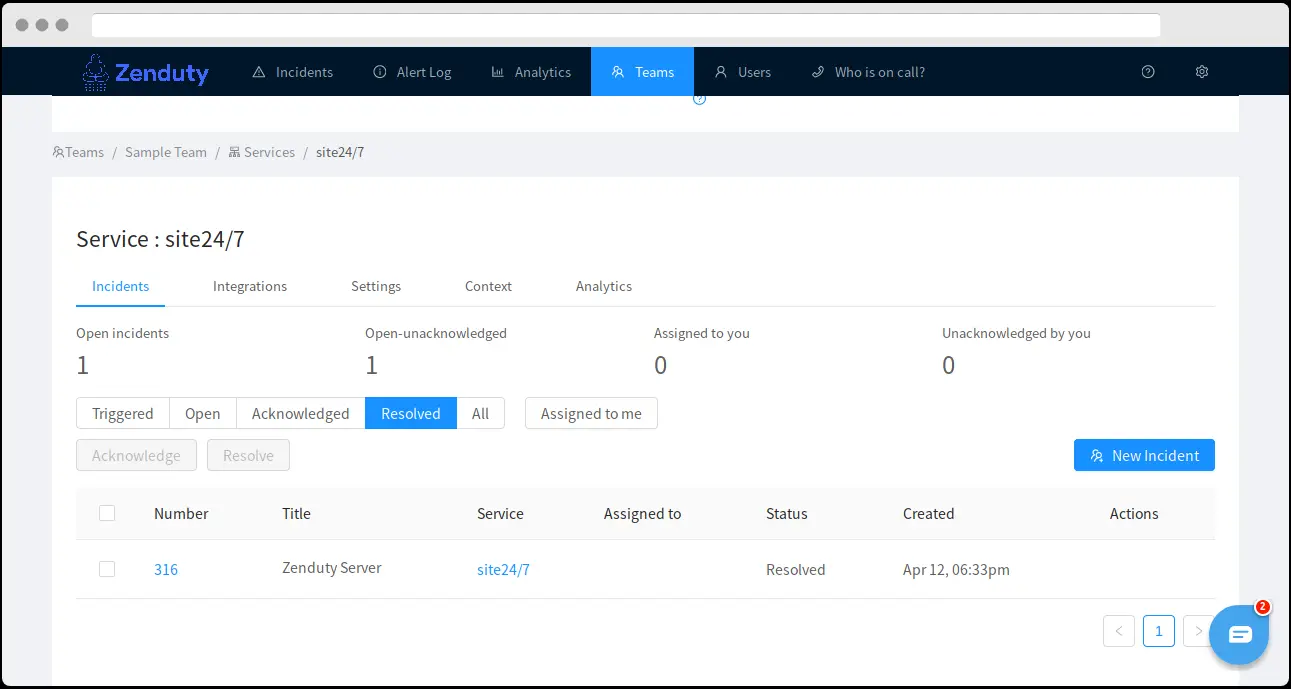
Once set up, users in Zenduty will get their incidents when the status of a monitor is in Trouble or Critical. When the monitor recovers, the incident will automatically be resolved.
Scroll to the end of the page for complete instructions to set up the integration. Read more on Zenduty Docs
Actions:
Once set up, users in Zenduty will get their incidents when a monitor is in Trouble/Critical. When the stats recover, the incident will automatically be resolved.
| Site24x7 Action | Zenduty Response |
|---|---|
| New error generated | New incident created |
| Changes made to the error | Note added to the incident |
| Error resolved | Incident resolved |
When a check fails, Zenduty will create an incident
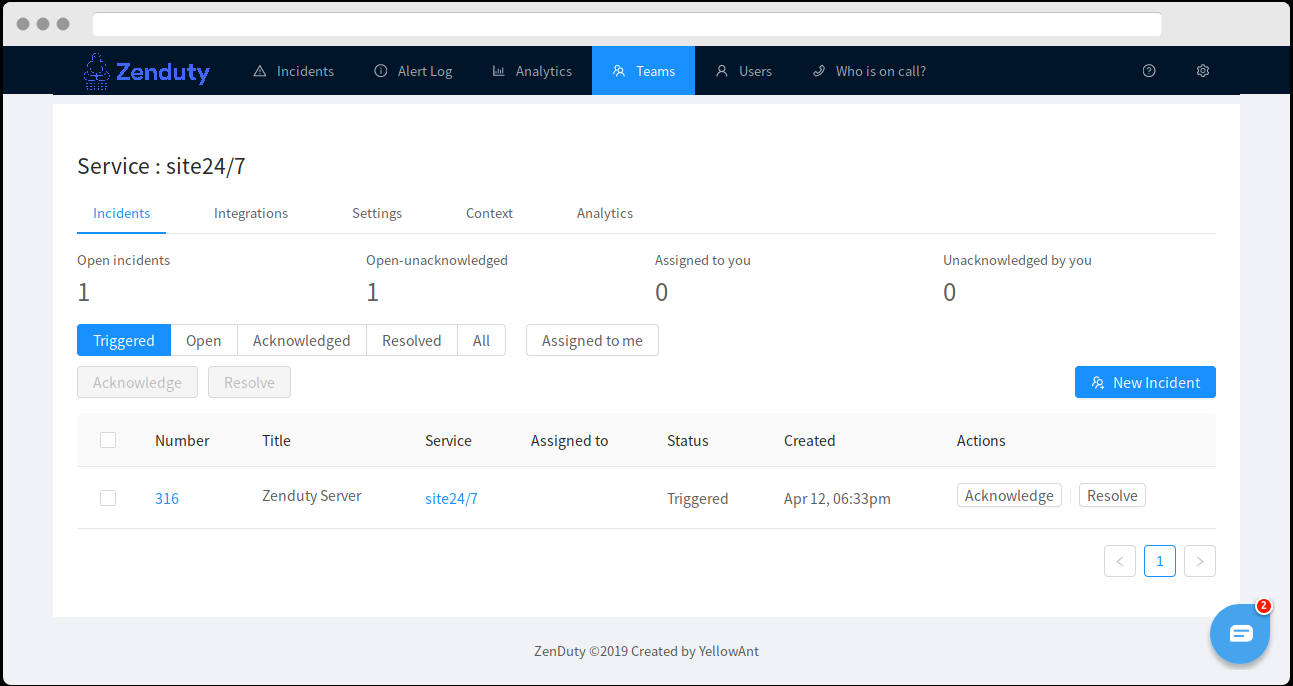
When the check recovers, the incident will be resolved automatically
Steps to Integrate:
In Zenduty:
- To add a new Site24x7 integration, go to “Teams” on Zenduty and click on the “Manage” button corresponding to the team you want to add the integration to.
- Next, go to “Services” and click on the “Manage” button correspoding to the relevant Service.
- Go to “Integrations” and then “Add New Integration”. Give it a name and select the application “Site24x7” from the dropdown menu.
- Go to “Configure” under your integrations and copy the webhooks URL generated.
In Site24x7:
- Log in to Site24x7. Click on admin on the menu and select “Third Party Integration”. Select “Webhooks”.
- Enter the name of the integration, paste the copied link in “Hook URL” and set the “HTTP method” as “POST” and click on “Save”.
- Set Trigger incidents when monitor is “Critical” and “Trouble Status” as “Yes”.
- Click on the “server” on the menu. Select the server you want to monitor and click “edit”.
- Click on ‘+’ next to “Threshold and Availability”.
- Enter the display name.
- Under “Threshold Configuration”, set notify the process down as “Down”.
- Set memory utilization threshold for “Trouble” and “Critical” and save it.
- In Edit monitor server, click on ‘+’ next to “Notification Profile”.
- Enter the display name. Set the downtime notification delay and save it.
- In Edit monitor server, add the third party integration as “Zenduty Webhook”.
- Click on save.
- Site24x7 is now integrated.